


Jaideep Saraswat, Nikhil Mall

Electric Vehicle (EV) adoption is gaining strong momentum in India. Sales have seen a sharp rise, increasing from 16.8 Lakh EVs sold in FY 2024 to 19.6 Lakh in FY 2025. This surge reflects the convergence of multiple factors: growing consumer awareness about sustainable transportation, a concerted push from government bodies at all levels, the launch of increasingly advanced and affordable EV models by Original Equipment Manufacturers (OEMs), and the rapid expansion of EV charging infrastructure across the country.
Yet, despite this positive trajectory, key challenges remain. According to the 2025 Global Automotive Consumer Survey by Deloitte, only 8 percent of Indian consumers expressed a preference for battery electric vehicles (BEVs) as their next vehicle. When plug-in hybrid electric vehicles (PHEVs) are included, the combined share rises to just 20 percent. This indicates a substantial gap between awareness and intent to purchase.
The survey further reveals the top consumer concerns: long charging times and a lack of accessible public charging infrastructure. These pain points highlight the critical role of building not just more, but better, charging infrastructure.
Encouragingly, the public charging station (PCS) landscape in India has expanded significantly. From a modest 1,800 PCSs in February 2022, the number has surged to 16,347 in March 2024, and further to 29,277 by May 2025. This growth is expected to continue under initiatives like the PM E-DRIVE scheme, which aims to add 22,100 fast chargers for four-wheelers, 1,800 for buses and heavy commercial vehicles, and 48,400 for two- and three-wheelers.
However, deployment alone is not enough, reliability is paramount. It is vital to ensure high uptime and functionality of charging stations so that EV users are not left frustrated by non-operational chargers. For this, real-time monitoring and data collection are essential.
Role of Data Transparency
This brings us to a crucial point: the need for data transparency in the EV charging ecosystem—not as a mere add-on, but as a foundational pillar of infrastructure success.
Currently, EV users in India often face uncertainty about charger availability, functionality, and wait times. Without reliable, accessible information, user trust in public charging remains fragile. While initiatives like the revamped EV Yatra application aim to offer real-time updates and booking features, the underlying data infrastructure must be significantly strengthened to support these efforts.
To ensure these systems function effectively, comprehensive data on charger uptime, usage trends, queue durations, and maintenance activities must be continuously gathered and analysed. At a minimum, this information should be available in real time to relevant government authorities. This would enable accurate performance assessments, enforcement of service standards, and strategic planning for future infrastructure deployment.
Transparency in this data is equally vital for users, allowing them to make informed decisions about where to charge and which stations to rely on. Furthermore, when shared with public utilities, this data becomes a valuable resource for grid planning, tariff structuring, and infrastructure development. It also supports better load forecasting, grid reliability, and integration of renewable energy sources.
Moreover, a portion of this data should be made publicly available. Open data can enable researchers, developers, startups, and civil society organisations to analyse patterns, identify gaps, and propose innovative solutions to enhance the EV ecosystem. Data transparency is not just about oversight—it’s about empowering a community of problem-solvers to accelerate India’s clean mobility transition.
Case Study: Insights from Publicly Available EV Charging Data at Simon Fraser University, Canada
To demonstrate the kind of rich, actionable insights that can be extracted from publicly available datasets, we analysed a comprehensive dataset from Simon Fraser University (SFU) in Canada, which documents EV charging sessions across the university campus. This case study underscores the value of open data in informing infrastructure planning, assessing performance, and improving user experience.
The dataset covers 62 charging stations located at various points across the campus. These include stations that have been operational since 2019, with additional ones added in subsequent years. For each charging session, the dataset captures detailed parameters such as:
- Charging station type and capacity
- Start and end dates and times
- Energy consumed
- Charging duration
- Session duration
Such granular data enables an in-depth understanding of usage patterns, reliability issues, and station-level performance.
Figure 1 presents the average and maximum charging durations observed across all stations. The stark difference between the average and maximum durations highlights that extremely long charging sessions are outliers, occurring only sporadically.
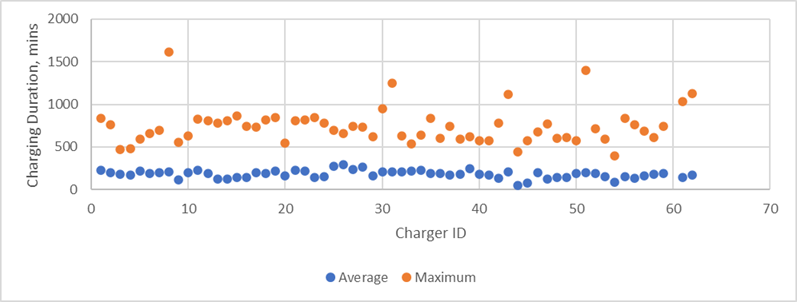
Figure 1: Average & Maximum Charging Duration (Mins) v/s Charger ID
Figure 2 focuses on failed charging sessions, identified by sessions lasting less than one minute. These failures could stem from a range of issues—such as internet connectivity problems, payment errors, or grid outages. Identifying and quantifying such sessions is crucial to assessing station reliability.
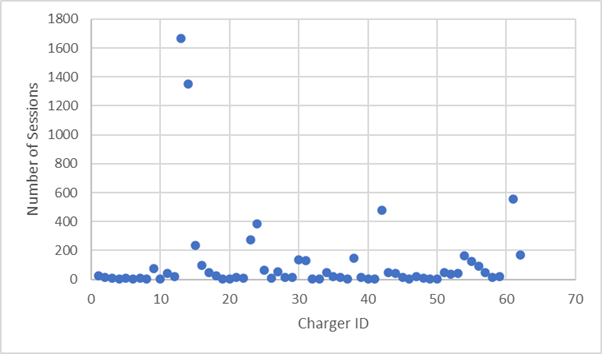
Figure 2: Failed Sessions (<1 min Charging Duration) v/s Charger ID
To this end, Figure 3 introduces a reliability score, calculated as the ratio of successful charging sessions to total sessions. A ‘successful’ session here is defined by a duration exceeding one minute. This score allows us to pinpoint stations that fall below 90 percent reliability, flagging them for further investigation and corrective action.
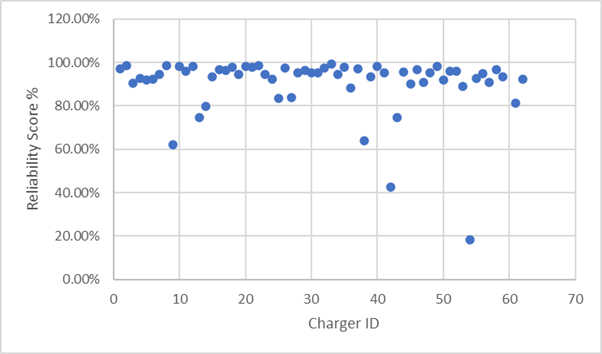
Figure 3: Reliability Score (%, <1min) for all the Charging Stations
This kind of analysis becomes even more relevant in the context of government-funded public charging stations. For instance, in California, a new regulatory standard mandates that starting January 1, 2026, all publicly funded charging stations must meet a Successful Charge Attempt Rate (SCAR) of at least 90 percent. Under this regulation, a session is only considered successful if it lasts more than 5 minutes.
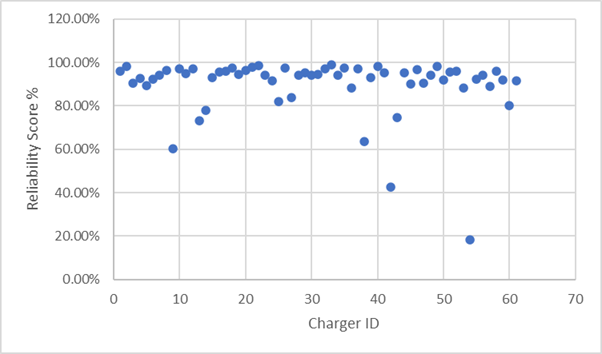
Figure 4: Reliability Score (%, <5min) for all the Charging Stations
Applying this stricter definition to the SFU dataset significantly reduces the reliability of multiple charging stations, causing their reliability scores to fall below 90 percent. It provides a clear benchmark for Charge Point Operators (CPOs) to monitor and improve their service levels, while also equipping policymakers with a robust metric to evaluate the performance of publicly funded infrastructure.
Figure 5 highlights a critical issue related to charger utilisation efficiency. It shows that while the charging duration has ended—indicating no further energy is being transferred to the vehicle—the charging session itself remains active, meaning the charging cable is still plugged into the EV.
On average, this post-charging idle time amounts to approximately 161 minutes across all stations. This behaviour—often referred to as charger hogging—significantly reduces the availability of charging stations for other users and undermines the overall efficiency of the EV charging infrastructure.
Such misuse points to a lack of adherence to proper EV charging etiquette by some users. To address this, it is essential to implement strict penalties or usage-based pricing models for vehicles that remain connected beyond the necessary charging period. Enforcing such measures will encourage responsible usage and ensure that charging stations are available to a larger number of EV owners when needed, especially in high-demand areas.
Figure 5: Number of Sessions with Charger Hogging (Over 10 Minutes After Completion) v/s Charger ID
Figure 6 illustrates the hourly usage patterns of all charging stations across a 24-hour period. The data reveals that most chargers experience minimal utilisation during the early morning hours—from 12:00 AM to 5:00 AM. Usage then picks up steadily as the day progresses. Interestingly, some chargers maintain a relatively high and consistent usage throughout the day, while for the majority, a noticeable drop in utilisation occurs around 10:00 AM, after which activity remains subdued. These insights are extremely valuable for CPOs. They can leverage this information to optimise operational strategies, such as introducing Time-of-Use (ToU) pricing models to encourage charging during off-peak hours and better distribute demand throughout the day.
From an infrastructure planning standpoint, the data helps identify high-traffic stations that may be approaching capacity limits. Such locations could be prioritised for expansion—either by upgrading existing infrastructure or adding new chargers—to prevent congestion and ensure a seamless charging experience. Additionally, CPOs might consider congestion management techniques, such as capping the maximum state of charge (SOC) to around 80–85 percent. This approach aligns with battery charging characteristics, wherein charging occurs at a higher rate until this threshold, after which the rate slows to avoid battery degradation.
Conversely, stations with consistently low usage might benefit from increased visibility through awareness campaigns, strategic relocation, or user incentives aimed at driving higher utilisation.
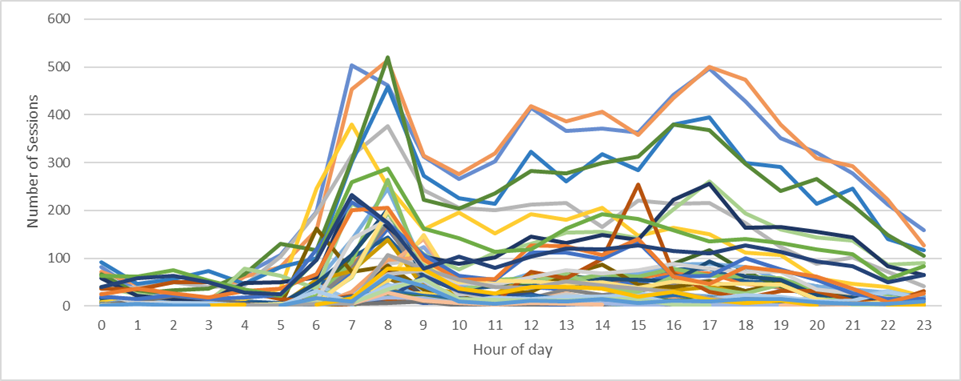
Figure 6: Charging Session Count by Hour of Day
To increase charger utilisation, the following strategies can also be explored:
- Dynamic Pricing Models: Beyond ToU, implement demand-based dynamic pricing that fluctuates in real time depending on occupancy rates and time of day to influence user behavior.
- Workplace and Residential Integration: Encourage companies and housing societies to promote the use of nearby public chargers through partnerships or discount programs.
- Improved Signage and Navigation Tools: Ensure visibility of underutilised chargers through better physical signage and integration with real-time navigation platforms and apps.
- Cross-Promotions with Local Businesses: Partner with retailers or cafes near underused chargers to offer combined discounts (e.g., free parking or coffee with a 30-minute charge).
- Fleet Partnerships: Collaborate with ride-hailing or delivery fleets to schedule vehicle charging at low-demand times using public infrastructure.
Implementing a mix of behavioural incentives, pricing innovations, and smart partnerships can significantly enhance utilisation, improve ROI for infrastructure investments, and ensure more equitable access to EV charging facilities across regions.
Conclusion
India is undoubtedly on the right path when it comes to EV adoption. However, to sustain this momentum and overcome the remaining barriers, infrastructure expansion must be complemented with data-driven decision-making and transparent governance. It is important to note that, as of now, there are no publicly available datasets on EV charging stations in India. A robust public charging ecosystem, backed by open data, will not only improve user experience but also build confidence, accelerate adoption, and support India in achieving its ambitious electric mobility targets.