


By Raghav Pachouri, Shubham Thakre, Sonam Sinha
Since Independence, the paradigm for the Indian power system was one of shortage due to deficiency in energy production. Electricity consumption was a mere 17 kWh per capita in 1947, and installed generation capacity was 1.36 GW. In the decades following, generation grew by 10-11 percent per year until 1980. This was significantly higher than the growth rate of real GDP for those corresponding years. However, it is only in recent years that the energy and peak deficit has fallen, from the long-running average of 8 percent and 15 percent respectively, to 0.4 percent and 1.2 percent respectively in 2022. Since 2018, India is facing the unusual situation of having surplus generation capacity coupled with low-capacity utilisation. However, most of this surplus capacity comes from excessive coal capacity addition during the 12th capacity addition plan.
In June 2022, India’s peak demand reached an all-time high of 212 GW. This constant rise in peak demand can be attributed to the economic growth, intense summers, and an increasing daily average temperature India has experienced over the last decade or so. Figure 1 shows the rise in monthly peak demand since 2010. If India’s strong economic growth trajectory continues, the annual peak demand is expected to reach 340 GW by end of year 2030. In this context, to manage peak demand, there is a need to address the challenge of resource adequacy and their optimum utilisation.
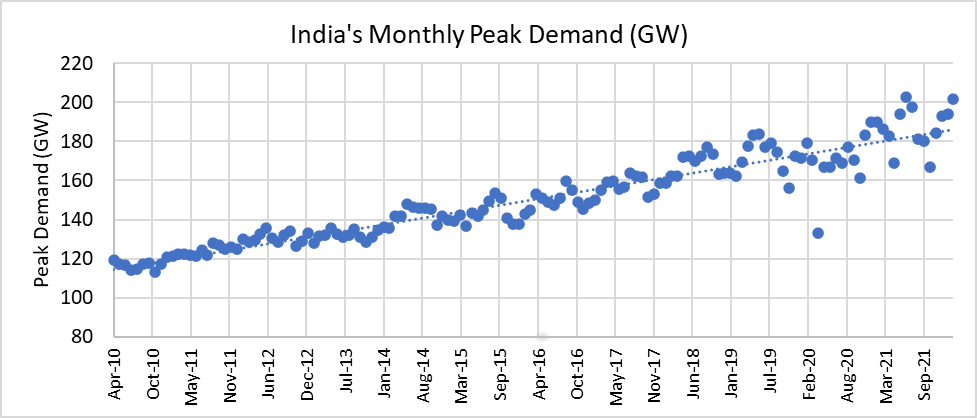
Figure 1: Monthly peak demand in GW, Source: CEA
Identifying Patterns in Yearly Peak Demand and Month of Peak Demand
In the past decade, the peak electricity demand in India has grown from 135 GW in 2013 to 203 GW in 2022 clocking an average growth rate of 4 percent, as shown in figure 2. Before the COVID-19 pandemic, electricity demand in India usually peaked during August and September, comprising a majority of the monsoon season. This spike in peak demand was primarily due to increase in domestic and commercial load, mainly space cooling load due to high humidity conditions. However, in the previous and current financial year, the annual peak demand occurred in summer season (April-July) due to extreme heat wave conditions.
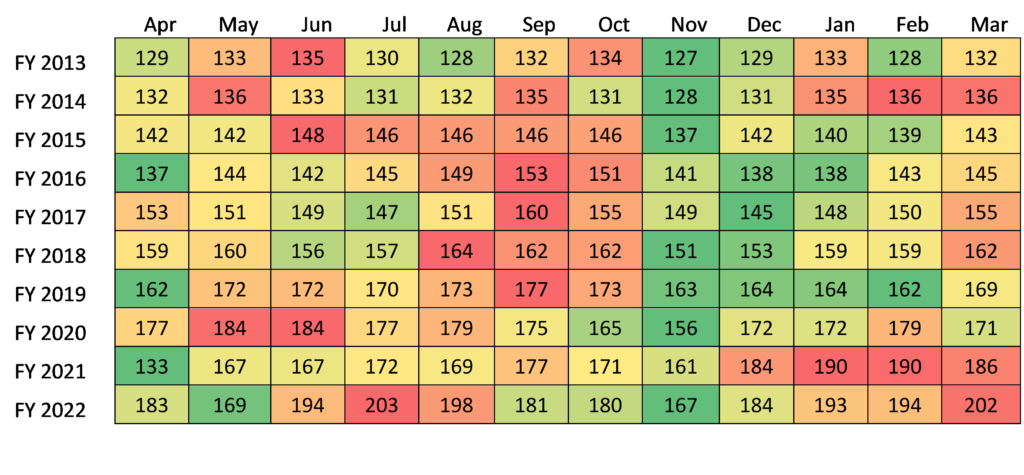
Figure 2: Monthly peak demand (GW) in last decade, Source: CEA, Green color suggests lean demand period of year and red color suggests peak demand period
High temperatures and severe heat wave is one of the reasons for the spike in electricity demand in June 2022, as Figure 2 shows. The effect of increase in temperature is the most prominent on commercial and domestic sector and hence lead to increase in electricity requirement for space cooling. Over the years, air-conditioning units, used across different sectors, have become more affordable not only due to increasing purchasing power but also improved financing mechanisms. Air-conditioning is now considered to be a necessity rather than a luxury. This can be gauged from the increase in sales of these units, which is expected to reach close to nine million units in 2023, as compared to three million units in 2018.
The impact of the high temperatures and heat wave on electricity demand in summer of the current year can also be seen in the daily demand curve illustrated in Figure 3. In the figure, we compared the daily demand curve of annual peak day of FY 2019 (September month), FY 2022 (July month) and FY 2023 (April month). In FY 2022 and 2023, the electricity demand peaked during day time – between 2-3 pm, whereas in FY 2019 the annual peak occurred in the evening, between 8-9 pm. However, a positive aspect of demand peaking during the day is that it can be better matched by supply from solar energy. This flattens the net demand met from conventional sources. Even with a greater share of renewables in 2022, the share of coal in the generation mix remains significant, especially to meet the peak demand. If we analyse the peak demand from 2018-19 to 2022-23, we can see that the contribution of coal generation reduced only marginally – from 72 percent to 70 percent, whereas, the Renewable Energy generation, especially from solar, rose from 5 percent to 17 percent. This contribution is substantial given that the peak has shifted to mid-day in the current FY.
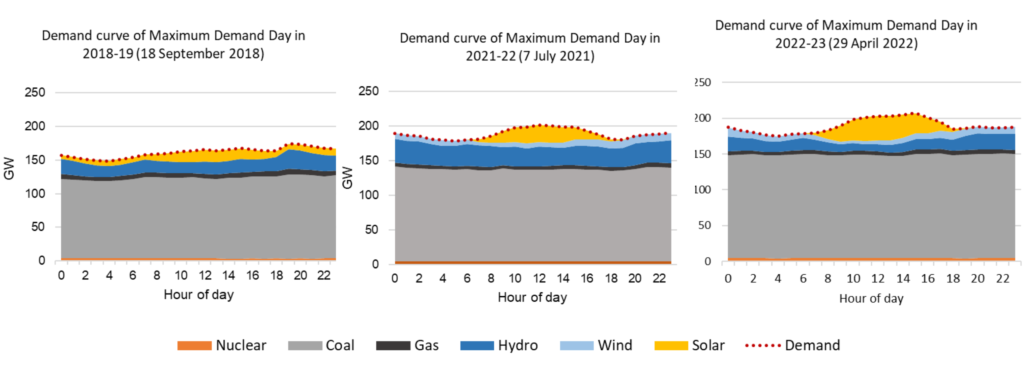
Figure 3: Peak day demand curve of FY 2019, FY 2022 and FY2023, and generation from various sources, Source: POSOCO [Data for 2018-19 in yellow highlights both solar and wind generation]
Increasing Variability in Electricity Demand
In figure 4, we analyse the electricity demand variability through a scatter plot in which the total hours (8,760) of a year are presented as a percentage of total hours on x-axis while the y-axis denotes the hourly load factor, i.e., the hourly demand as a ratio of maximum demand of the calendar year. We plot the hourly load factors in a decreasing order to analyse the duration of demand occurrence in a calendar year (CY).
The lower demand duration curve of CY 2021 suggests the increasing range of maximum and minimum demand within the year. Peak demand in CY 2021 was higher but occurred for a shorter period of time compared to the previous years. Similarly, in CY 2021, the minimum demand was 52 percent of peak demand as compared to 58 percent in CY 2017. This increasing variability poses a significant challenge in managing peak deficit and grid operation.
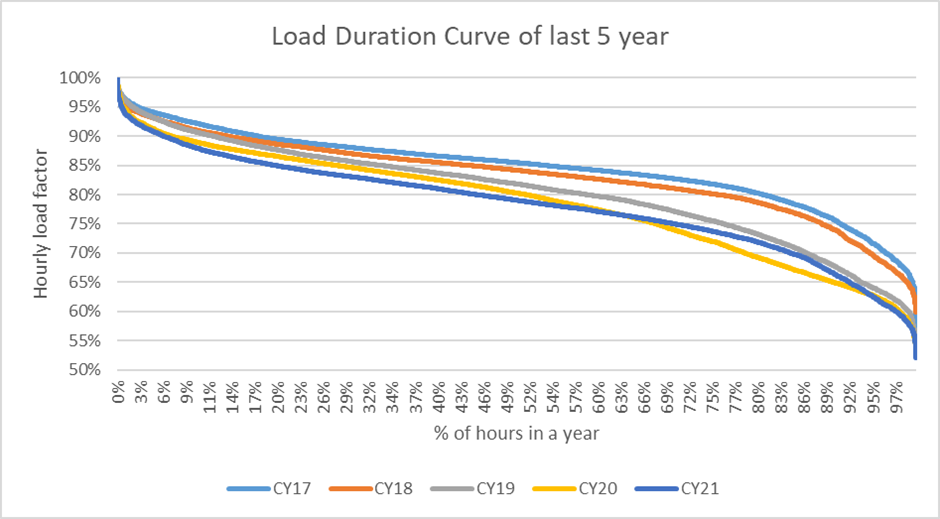
Figure 4: Load duration curve of last 5 year; Source: Authors analysis
Analysis of comprehensive hourly energy demand helps in developing better understanding of the dynamic changes with in the sector. For an adequate and optimised resource planning, the addition of new resources to meet the demand requirement should not only meet the total demand but also cost optimally meet the peak requirement. And, this can be done by accurate demand forecasting.
As is evident from the discussion above, the peak electricity demand and demand curve patterns are changing yearly, seasonally, and even hourly. However, in recent years Indian power sector has attained a comfortable position in terms of meeting peak demand as well as overall electricity demand. However, increasing electricity demand and its variability will pose new challenges in the future. Considering India’s rich solar potential, a positive correlation of the RE generation specially solar with the peak demand would ease this challenge. Therefore, a rise in share of renewables in meeting peak demand is a positive sign, however, regional impact of this penetration can affect grid operation, which we will discuss in our next blog. These challenges have to be synchronised with the ongoing Renewable Energy transition.
In Part 2 of this blog series, we will discuss the regional contribution in the peak demand change and some useful insight through comparison with regional economic growth.