


Jaideep Saraswat, Nikhil Mall, Tushar Katiyar

The global shift towards clean energy is swiftly gaining momentum, propelled by a myriad of green technologies such as renewables, energy storage solutions, green hydrogen, electric mobility and more. While many of us are familiar with these technologies and frequently discuss them in our daily lives, this blog seeks to delve deeper into some lesser-known and often overlooked data points surrounding these clean technologies. By shedding light on these nuances, we aim to provide a comprehensive understanding and appreciation of the multifaceted landscape of clean energy innovation.
Let us begin with systematically exploring various technologies, and uncovering fascinating data points associated with each one.
Green Hydrogen
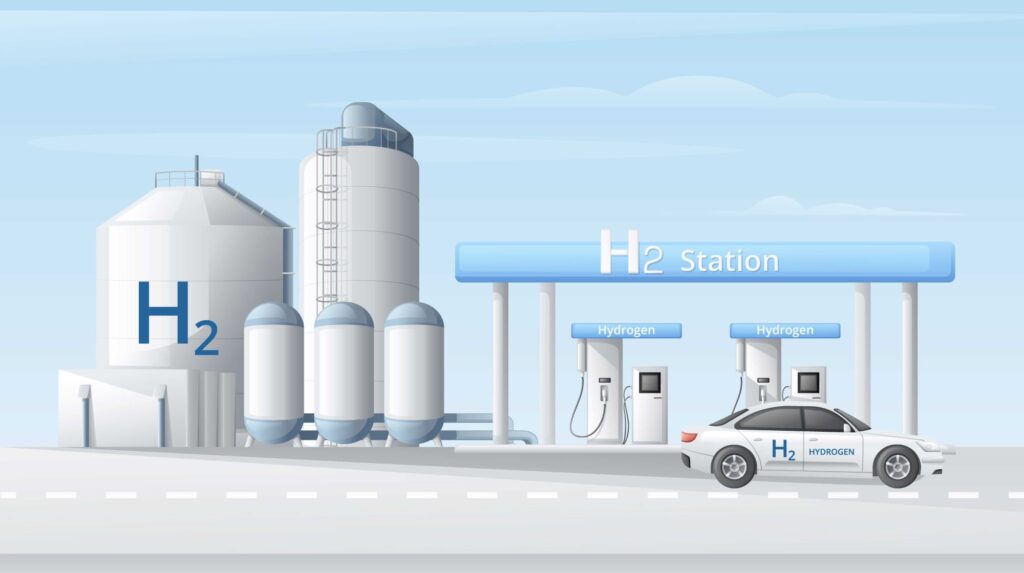
Green hydrogen is poised to play a critical role in decarbonizing hard-to-abate sectors such as steel, cement, and long-haul trucking. The process of generating green hydrogen through electrolysis typically consumes between 45 to 55 kWh of renewable electricity per kilogram of hydrogen, although some cutting-edge electrolyzers in the R&D phase have achieved lower energy requirements, reaching as low as 40 kWh per kilogram.
Electrolysis, as the method for hydrogen generation, necessitates water as its primary input. The 1:9 ratio for ultrapure water consumption in green hydrogen production stems from the atomic composition of water—wherein hydrogen, being significantly lighter than oxygen, accounts for only a fraction of water’s mass. Consequently, producing 1 kilogram of hydrogen requires approximately 9 litres of water. Larger electrolyzer capacities, such as a 1 MW electrolyzer, demand around 0.2 cubic meters per hour of ultrapure water. Scaling up the size of the electrolyzer plant results in increased water demands. For instance, a 10 MW plant requires approximately 2 cubic meters per hour of ultrapure water, while a massive 1 GW plant necessitates around 200 cubic meters per hour. To meet the demand for ultrapure water, various water sources can be utilised. Extracting 1 cubic meter of ultrapure water requires different quantities of raw water, such as 1.4 cubic meters of groundwater, 1.5 cubic meters of treated wastewater or surface water, or 3.3 cubic meters of seawater.
Addressing concerns regarding the energy intensity of water treatment for electrolysis, it’s worth noting that purifying 1 cubic meter of water consumes minimal energy compared to electrolysis itself: approximately 2 kWh for groundwater, 2.2 kWh for treated wastewater, and 7 kWh for seawater. In contrast, electrolyzing 1 cubic meter of water requires a staggering 5000 kWh of electricity.
For hydrogen storage, several methods exist, including compression, liquefaction, chemical hydrides, and more. Compression, storing hydrogen in high-pressure tanks ranging from 350 to 700 bar, demands roughly 6 kWh of energy per kilogram of hydrogen, resulting in a volumetric hydrogen density of 42 kg/m³. Liquefaction, with energy requirements varying between 3.3 to 13 kWh per kilogram depending on operational factors, achieves a higher volumetric density of approximately 70.8 kg/m³.
As an alternative, the conversion of hydrogen to ammonia presents a promising option, with 1 kilogram of ammonia production necessitating approximately 0.17 kilograms of hydrogen. Ammonia offers an even greater volumetric hydrogen density, ranging from 107.7 to 120 kg/m³.
Electric Vehicles (EVs)
India’s transportation sector accounts for 18.67% of the total petroleum products consumption, which stood at approximately 248 million metric tons in 2023. Transitioning to EVs is crucial for India to achieve its climate targets. In recent years, India has witnessed significant growth in EV adoption, with 697 manufacturers, including both legacy companies and startups, venturing into this domain, primarily focusing on high-voltage (HV) EVs. As a result, EV sales per 1000 vehicle sales rose from 24 in the FY 2021-2022 to 53 in 2022-2023 and further increased to 68 in 2023-2024.
As per ISO 6469-3 standards, HV vehicles fall under voltage class ‘B,’ operating on DC voltage ranging from 60 V to 1500 V or AC voltage within the range of 30V to 1500V. Regarding charging infrastructure, the number of charging stations has substantially increased to 16,348 as of April 2024, with 11,385 being AC charging stations. On average, each charging station caters to around 13 electric 4-wheelers, aligning closely with the global standard of 10 vehicles per charging station.
From the perspective of Charge Point Operators (CPOs), the breakeven model indicates that if the utilization of a 50 kW DC charger is below 10%, the price per unit charged by the CPO stands at approximately ₹35. However, with a utilization rate of around 50%, the price per unit can decrease to ₹12. The scenario is more favourable for AC chargers, hence the higher number of AC charging stations as mentioned earlier.
Delving deeper into EVs, battery capacities vary from 1.5 kWh for electric two-wheelers to 300 kWh for electric trucks. Each kWh of a lithium-ion battery pack weighs approximately 5-7 kg, depending on the chemistry and manufacturer. In terms of critical mineral weight, a 1 kg lithium-ion battery pack contains around 0.09 kg of lithium and 0.78 kg of graphite. Assuming the weight of 1 kWh of a lithium battery is 6 kg, the lithium-ion concentration will be 0.54 kg, and graphite consumption will be 4.68 kg.
Recently, there has been a shift in focus towards Sodium-ion batteries by several countries and organizations. These batteries are bulkier than lithium-ion batteries due to their lower energy density. However, ongoing research has been narrowing the gap between the two technologies. On average, 1 kWh of a sodium-ion battery weighs around 6.5-8.5 kg, with a battery pack containing 0.89 kg of sodium which tends to be distributed more evenly across different geographical regions.
Finally, when comparing recycling to mining and refining of virgin minerals, in terms of emissions and energy consumption, producing 1 kg of finished battery material results in 194 MJ of energy consumption and 14.5 kg of CO2 emissions. Conversely, typical battery recycling processes consume between 40-146 MJ of energy and emit 6.5 to 10.4 kg of CO2, highlighting the significant importance of prioritizing the establishment of recycling facilities on a larger scale.
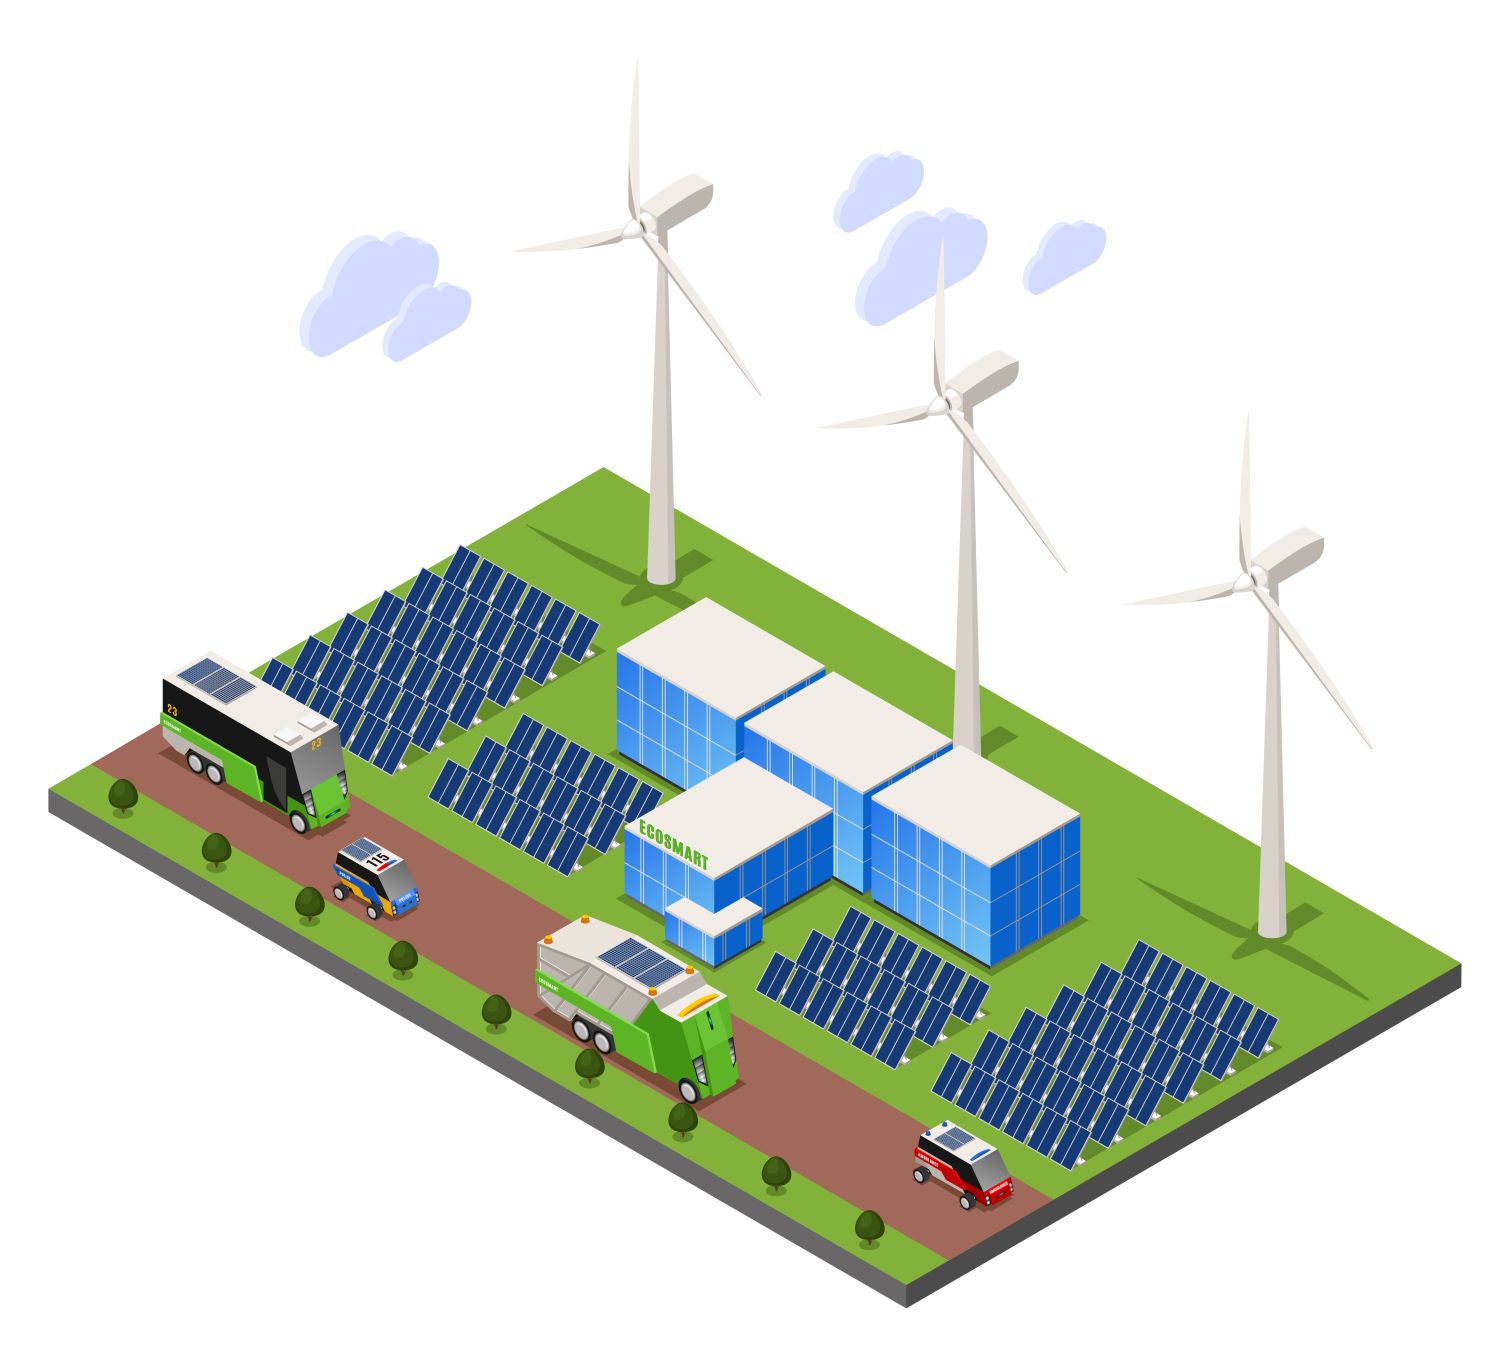
Solar PV
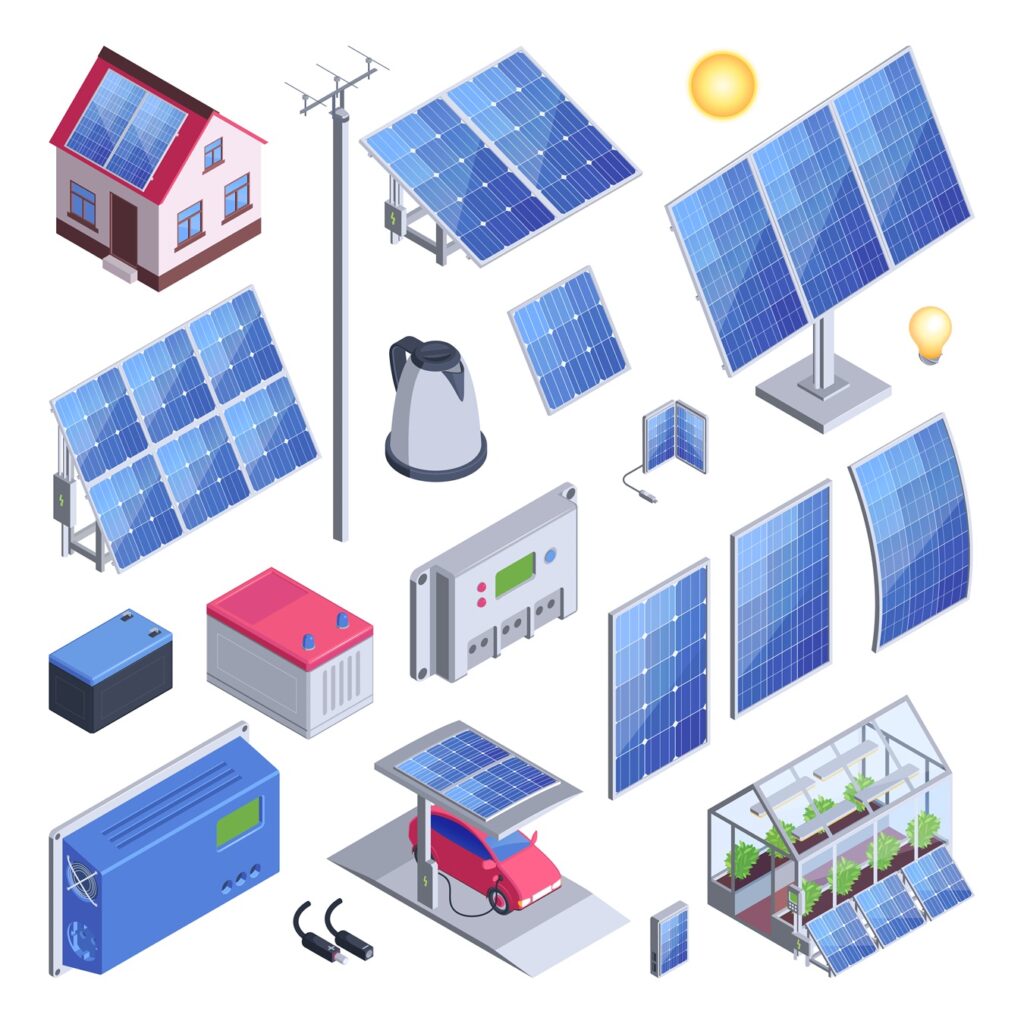
Solar PV has emerged as the cornerstone of strategies aimed at decarbonising the power sector. The solar PV module, a pivotal component, has witnessed a remarkable increase in efficiency, reaching up to 23%. The efficiency of solar PV is approaching the theoretical maximum efficiency known as the Shockley-Queisser limit, which is 33.7% for single-junction silicon-based solar cells. The weight of solar modules ranges from 22 kg for monofacial modules to 40 kg for glass-glass bifacial modules. Recently, India has experienced a significant surge in manufacturing capacity over the past few years, with the current capacity standing at approximately 65 GW for solar PV modules. Among these, the capacity listed in the Approved List of Modules and Manufacturers (ALMM) as of April 2024 totals around 41.46 GW. Notably, the latest ALMM includes the enlistment of new module technologies such as TOPCoN, with a capacity of around 1.3 GW.
Artificial Intelligence (AI)

AI is increasingly becoming a crucial tool utilized by researchers, organizations, and policymakers in their efforts to explore avenues for decarbonising various sectors. Understanding the fundamental aspects of this growth is imperative. The operation of AI necessitates large data centres for efficient functioning, and in 2022, these centres accounted for 1% of India’s power consumption. The significant rise in AI’s prominence occurred when it became accessible to the general public, notably with the release of ChatGPT by OpenAI. By December 2023, ChatGPT had garnered 1.6 billion visits and boasted 100 million active users. In terms of user engagement, India ranked second globally, accounting for 7.63% of ChatGPT’s user base, following the USA.